Hello, my name is . Welcome to my blog on algorithms! In this article, we will explore the fascinating world of algorithm flowcharts. Learn how these visual representations help us understand and design efficient algorithms.
Unlocking the Secrets of Algorithm Flowcharts: A Comprehensive Guide
Unlocking the Secrets of Algorithm Flowcharts: A Comprehensive Guide
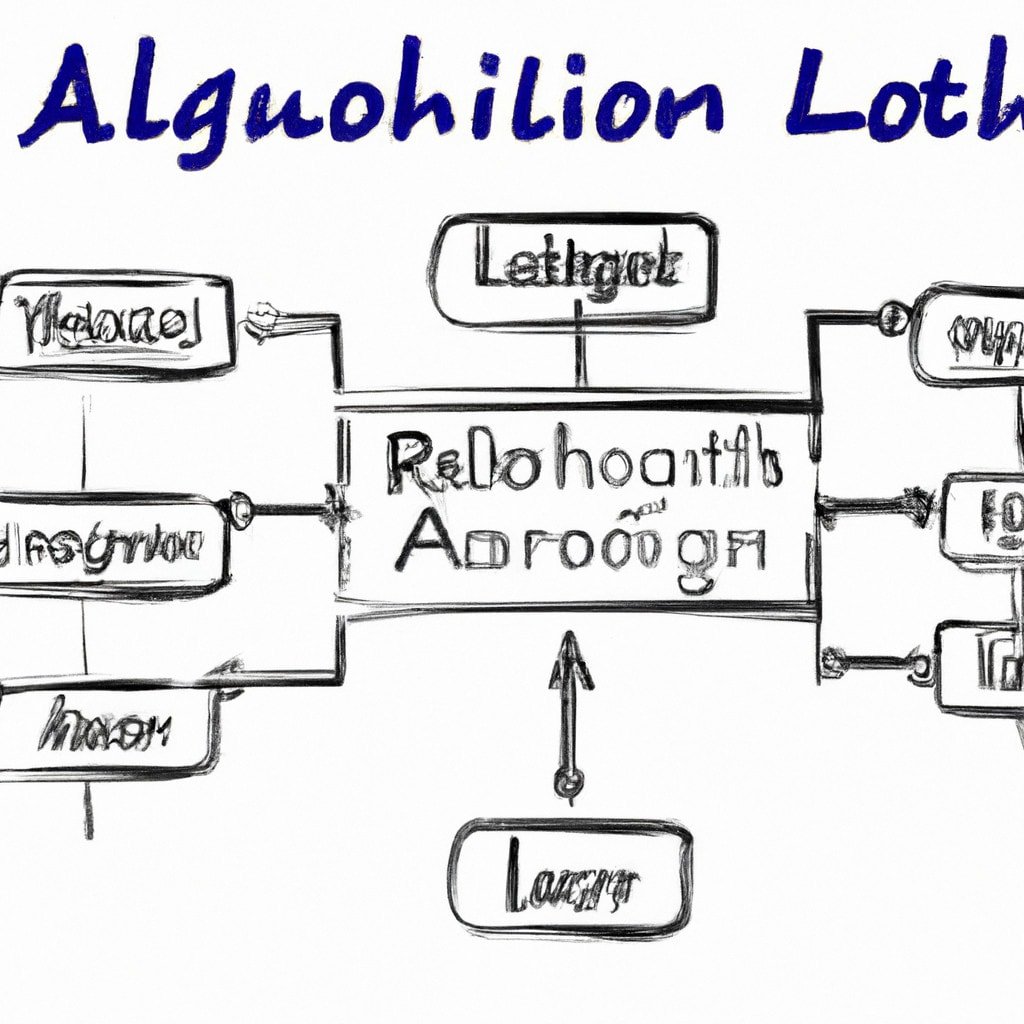
An algorithm flowchart is a visual representation of the step-by-step process required to solve a given problem or accomplish a specific task. These flowcharts are essential tools in the world of algorithms, providing a clear and concise roadmap for programmers and developers.
Designing Algorithm Flowcharts
The first step in creating a successful algorithm flowchart is to identify the main components of the task at hand. This includes the inputs, outputs, variables, and conditional statements that will guide the flow of the algorithm. Once these components have been established, a logical order can be devised to ensure that each step leads to the next.
Flowchart Symbols and Notations
In order to communicate the various components and structures of an algorithm effectively, flowcharts utilize a standardized set of symbols and notations. The most common symbols include:
1. Oval: Used to represent the start and end of the process.
2. Rectangle: Denotes an operation or action that needs to be performed.
3. Diamond: Represents a decision point or conditional statement.
4. Parallelogram: Symbolizes input/output operations.
5. Arrow: Indicates the flow of control from one step to the next.
Best Practices for Creating Algorithm Flowcharts
When designing an algorithm flowchart, it is important to keep the following best practices in mind:
– Use clear and concise language to describe each step.
– Arrange the components in a logical order, with minimal crossing of lines.
– Utilize proper symbols and notations consistently throughout the flowchart.
– Always verify the accuracy and completeness of the algorithm before finalizing the flowchart.
Benefits of Using Algorithm Flowcharts
Algorithm flowcharts offer numerous advantages when it comes to problem-solving and programming. Some of the primary benefits include:
– Improved understanding of the problem and its components.
– Enhanced communication and collaboration between team members.
– Easier identification and correction of errors or inefficiencies within the algorithm.
– A visual aid for debugging and troubleshooting during the development process.
In conclusion, algorithm flowcharts are a powerful tool that can help streamline the development and implementation of innovative solutions across a wide range of industries. By adhering to best practices and utilizing standardized symbols, these flowcharts can greatly enhance the clarity and effectiveness of any algorithm-based project.
WHAT is GOING ON with DISNEY Vacation Club?
Algorithms Explained for Beginners – How I Wish I Was Taught
How can one create an algorithm for a flowchart?
Creating an algorithm for a flowchart involves a series of steps to define a problem and outline the steps required to find a solution. The process can be broken down into the following key stages:
1. Define the problem: Identify the issue you want to address, which will serve as the basis for your algorithm. Be clear about the input requirements and desired output.
2. Identify the main steps: Break the problem down into smaller, manageable tasks. Determine the order in which these tasks should be executed to efficiently reach the desired outcome.
3. Create a flowchart: Start with the initial input and create a visual representation of each step in the algorithm using flowchart symbols, such as rectangles for processes and diamonds for decisions. Make sure that each symbol is connected by arrows to represent the flow of data or control within the algorithm.
4. Optimize the algorithm: Analyze your flowchart to identify any redundant or inefficient steps. Make modifications to streamline the process, keeping in mind the trade-offs between complexity and efficiency.
5. Test the algorithm: Make sure your algorithm works as intended by running through various test cases. Use different inputs and verify that the algorithm produces the correct output in each case.
6. Iterate and refine: As you test your algorithm, make adjustments to improve its functionality and efficiency. Continue refining the algorithm and flowchart until you are satisfied with its performance.
By following these steps, you can create a well-structured algorithm for a flowchart that effectively addresses the problem at hand and leads to an efficient solution.
Rewrite the following question: Which came first, the flowchart or the algorithm? Write only in English.
In the context of algorithms, which was developed initially: the flowchart or the algorithm?
What are the 8 fundamental symbols utilized in a flowchart?
In the context of algorithms, flowcharts are a visual representation of a process or an algorithm using various shapes and symbols. The 8 fundamental symbols utilized in a flowchart are:
1. Oval: Represents the Start and End points of the process. It is used to show the beginning and completion of the algorithm.
2. Rectangle: Represents a Process or an Operation that needs to be performed. It is used to indicate actions or operations performed in the algorithm.
3. Parallelogram: Represents Input and Output operations. This symbol is used when data is being inputted or outputted from the system.
4. Diamond: Represents a Decision or a Conditional statement. It is used to show branching in the algorithm based on specific conditions.
5. Circle: Represents a Connector, which is used to connect flow lines in the flowchart. It can also be used to represent the start or end of a loop.
6. Arrow: Represents the Flow Line or the direction of the process flow. Arrow symbols are used to show the order in which steps in the algorithm are executed.
7. Document: Represents information stored in a Document format, such as a file or a report. This symbol is used when data is being read or written from a physical document.
8. Database: Represents Data Storage or accessing data from a database. This symbol is used when data is being stored or retrieved from a database system.
These symbols, when combined in a structured manner, help in understanding the logical flow and steps involved in an algorithm or a process.
What are the key components of designing an algorithm flowchart for a specific problem-solving task in computer programming?
In the context of algorithms, designing an algorithm flowchart for a specific problem-solving task in computer programming involves several key components. These include:
1. Define the problem: Clearly understand and describe the problem that needs to be solved.
2. Identify the inputs and outputs: Determine the input values that the algorithm will need to process and the output values it needs to produce.
3. Break down the problem: Divide the overall problem into smaller, manageable subproblems or tasks that can be solved more easily.
4. Develop a step-by-step process: Create a sequence of steps that the algorithm should follow to solve the problem. Make sure to include conditional statements and loops as needed.
5. Construct the flowchart: Using standard flowchart symbols, represent the algorithm’s steps visually. This includes symbols for processes, decisions, input/output, and start/end points.
6. Test the flowchart: Walk through the flowchart with different sets of input data to ensure that it produces the correct output and is free of logical errors.
7. Optimize the algorithm: Look for areas where the flowchart can be simplified or improved to increase efficiency and performance.
8. Document and communicate: Add necessary annotations and comments to the flowchart to make it easier for others to understand and interpret. Share your work with colleagues or team members for feedback and collaboration.
By following these key components, you can create a clear and effective algorithm flowchart that helps in solving a specific problem in computer programming.
How can one effectively visualize and interpret different decision points, loops, and processes within an algorithm flowchart?
In the context of algorithms, effectively visualizing and interpreting different decision points, loops, and processes within an algorithm flowchart can be achieved through the following guidelines:
1. Use standardized symbols: Employ clear and universally recognized symbols to represent various process elements like decision points, loops, and processes. This ensures that anyone who examines the flowchart will be able to understand it easily.
2. Organize elements sequentially: Arrange the flowchart elements in a top-to-bottom or left-to-right sequence to represent the chronological order of the algorithm execution.
3. Label elements and connectors: Clearly label each element with brief descriptions to provide clarity on the specific function it plays within the algorithm. Connectors between the elements should also be labeled with relevant information, such as the condition being tested in a decision point.
4. Maintain readability: Ensure your flowchart is easy to read by avoiding clutter and using appropriate spacing between elements. Utilize colors and varying text styles to highlight important components or sections within the flowchart.
5. Keep it modular: Break down complex algorithms into smaller, more manageable modules or sub-processes to make understanding and interpretation easier. Encapsulate these modules in separate flowcharts and reference them within the main flowchart.
6. Iterate and refine: Review the flowchart repeatedly and seek feedback from others who possess knowledge of the underlying algorithm to ensure all components are accurately represented and easily understood.
By adhering to these six guidelines, anyone working with algorithms can create an informative and visually effective flowchart that effectively communicates decision points, loops, and processes within an algorithm. This, in turn, leads to improved understanding and efficient problem-solving.
Which best practices should be followed when creating an algorithm flowchart to ensure clarity, efficiency, and accuracy in the final design?
When creating an algorithm flowchart to ensure clarity, efficiency, and accuracy in the final design, consider the following best practices:
1. Define the problem clearly: Before designing the flowchart, make sure you have a comprehensive understanding of the problem you aim to solve.
2. Use standard symbols: Adhere to the universally accepted symbols for various flowchart elements, such as rectangles for processes, diamonds for decisions, and circles for connectors.
3. Maintain a logical flow: Arrange your flowchart elements in a top-to-bottom, left-to-right manner, using arrows to indicate the direction of the workflow.
4. Keep it simple and concise: Eliminate any unnecessary complexity and prioritize clarity to make the chart easy to follow.
5. Label elements accurately: Ensure that each element in the flowchart is labeled with clear, descriptive language that accurately represents what it stands for.
6. Use sub-processes: Break down complex processes into smaller sub-processes, which can be represented by separate flowcharts to improve readability and organization.
7. Test the flowchart: Once the chart is complete, perform a thorough review and test it against various scenarios to ensure it functions correctly and efficiently.
8. Use color-coding and formatting: Make use of different colors and formatting options to emphasize important elements or group related processes together.
9. Optimize the design: After testing, analyze the flowchart for potential improvements, such as eliminating redundancies, simplifying decision-making steps, or reorganizing elements for better readability.
10. Seek feedback from others: Share the flowchart with colleagues or stakeholders to obtain their input and ensure that the final design is clear, accurate, and universally understood.


